City centre revival or flight to the suburbs?

How London’s housing market is evolving in response to COVID-19.
Our latest quarterly Housing Market Summary highlighted that March saw a post Global Financial Crisis (GFC) record number of housing transactions, at almost 190,000. This really demonstrates the impact of tax on incentivising housing market activity in the UK (the previous post GFC record was in March 2016 before the introduction of higher rates for additional properties). It is fair to say that even with the clearly effective policy intervention from the government, the strength of the housing market despite the huge hit to the economy has surprised almost everyone. Indeed, the latest Nationwide house price data showed that annual growth increased to 7.1% in April, from 5.7 % in March, representing the biggest month-on-month increase since February 2004.
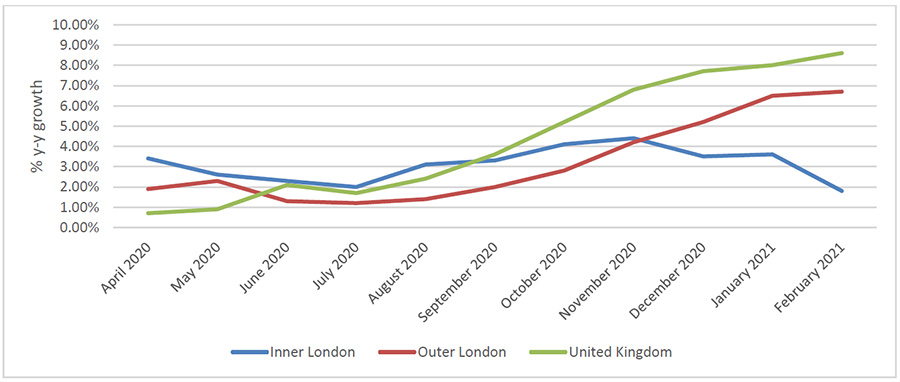
However, the picture is not uniform across the country. A topic that is at the forefront of discussion in the industry and wider society is the future of city living. Reviewing the performance of London’s housing market compared to the wider country suggests that the experience of the pandemic has led to people reappraising their housing choices, as the reality of lockdowns and homeworking set in. Figure 1 shows the stark divergence in performance of London compared to the wider UK since the pandemic began last year. Not only has London’s housing market underperformed the UK as a whole but the denser, more urban inner London market has substantially underperformed outer London.
Figure 1- y-y% house price growth, London vs UK
Source: Land Registry
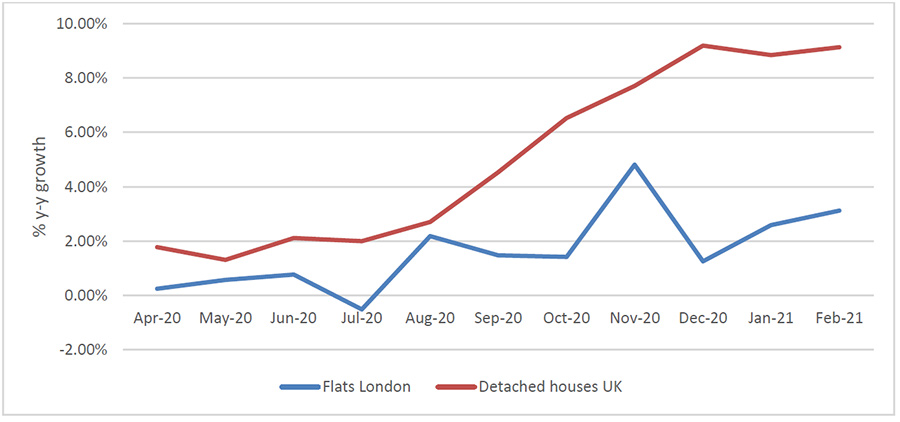
This suggests proximity to traditional employment centres has been traded for amenity and space, with people moving to suburban locations where they can live in bigger properties more suited to their current needs. The comparison of the performance of flats during the pandemic to detached houses shows this clearly and Figure 2 shows the two ends of the scale, contrasting the performance of flats in London to detached houses in the UK, over the course of the pandemic.
Figure 2- y-y% house price growth, London flats v UK detached houses
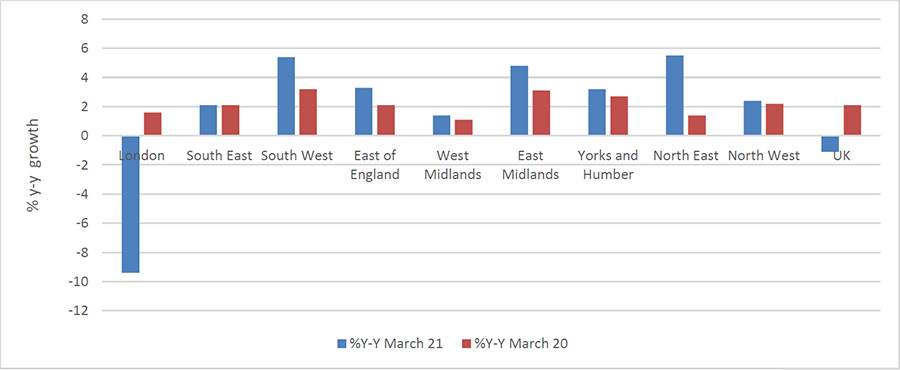
The same story is even more pronounced in rental markets. Zoopla’s Rental Index, which monitors newly agreed lets, shows the impact on London rents compared to other regions and the difference in performance in the year to March 21, compared to March 20 (Figure 3). Overall, in the year to March 21, Zoopla recorded a 9.4% fall in rents in London, compared to growth of 1.6% the year before.
Figure 3 - %y-y rental growth by region
Source: Zoopla
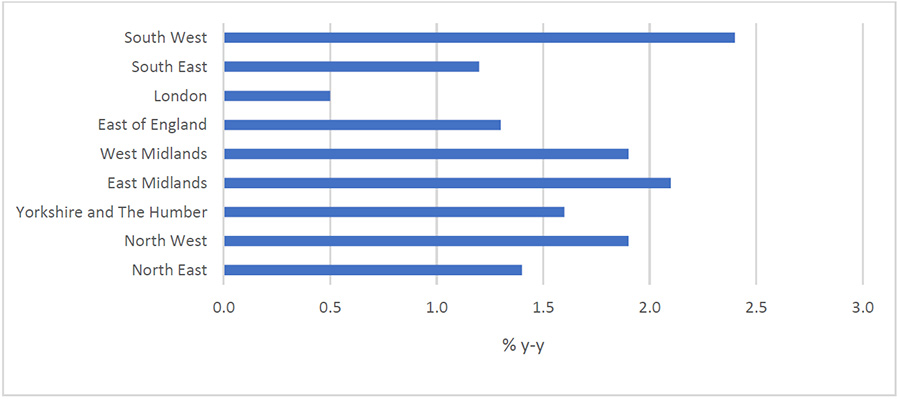
The ONS Index of Private Housing Rental Prices (IPHRP) includes a mixture of newly let properties and existing lets and therefore provides an arguably more balanced picture. New lets, rather than renewals, tend to see the biggest price changes and the IPHRP also reflects the stock of rents and not just the ‘flow’ of new rents. It reports a less dramatic picture for London overall, with rents in the year to March 21 growing by 0.5%. This compares to 1.3% at the same time last year.
Figure 4 - IPHRP % change over the 12 months to March 2021 by region
Source: ONS
Outlook
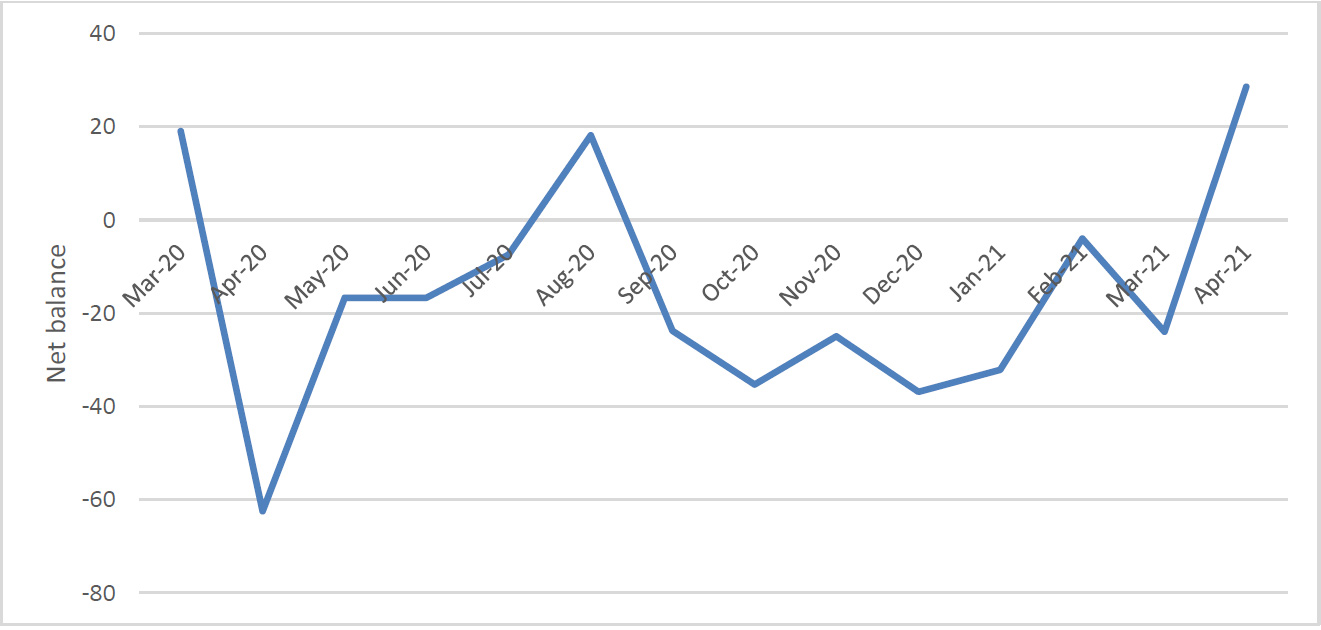
There are now some pretty encouraging signs that the tide is beginning to turn for London. Last year, Avison Young developed the UK Cities Recovery Index which blends traditional metrics with high frequency data to produce an up-to-date picture of the performance of our cities. London consistently underperformed the National Index (except briefly in September) but since restrictions began to be lifted following the third lockdown, the capital has been outperforming the national figures. Perhaps most notably, it is now ahead of our National Index for Return to Office. This suggests there is a material difference in how willing people now are to travel into London, compared to other periods after restriction easing during the pandemic. This shift in mentality will likely feed through to demand for London housing and indeed April’s RICS Residential Market Survey (a good lead indicator) reported a big upswing in tenant demand for London and the first time London has had a positive figure since August 20.
Figure 5 – Net balance of tenant demand, London
Source: RICS
Overall, we feel that London has a compelling set of underlying drivers that will support its recovery in 2021. We are optimistic that international demand will return, although the pace of this is limited by vaccine rollout abroad and there will also be some permanent losses from Brexit.
Domestic demand should also recover strongly in the second half of the year. We think that while more flexible working practices are now a given, it does not mean ‘at home every day’ and London city centre living will regain the magnetic pull it has had for the last thirty years.
Avison Young's latest Housing Market Summary for Q1 2021 can be viewed here.

